Understanding how weather shapes performance starts with a clear framework for testing it. Having established the core methods previously, where we explained how we use physics-based modeling to isolate the effects of temperature, pressure, humidity, and altitude on ball flight, we can now explore how those principles play out in baseball. Here we apply that framework through a set of controlled simulations to see how changes in the atmosphere can influence the way the game is played.
The idea is simple: keep the launch conditions the same, adjust one weather variable at a time, and see how the results change.
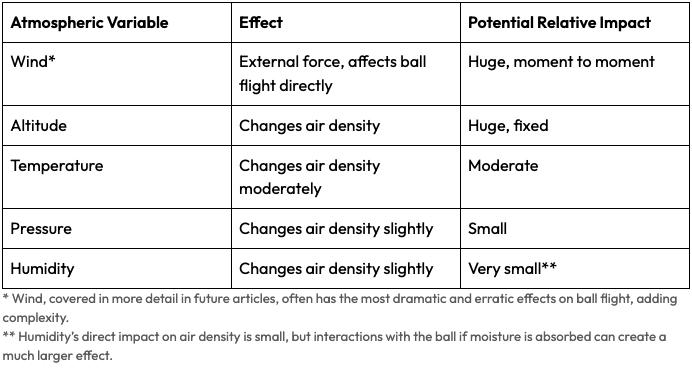
As a quick reminder, for this and similar analyses we are focusing only on atmospheric conditions that impact air density. Wind is not included, as it introduces a separate layer of complexity that we will address in future explorations.
.
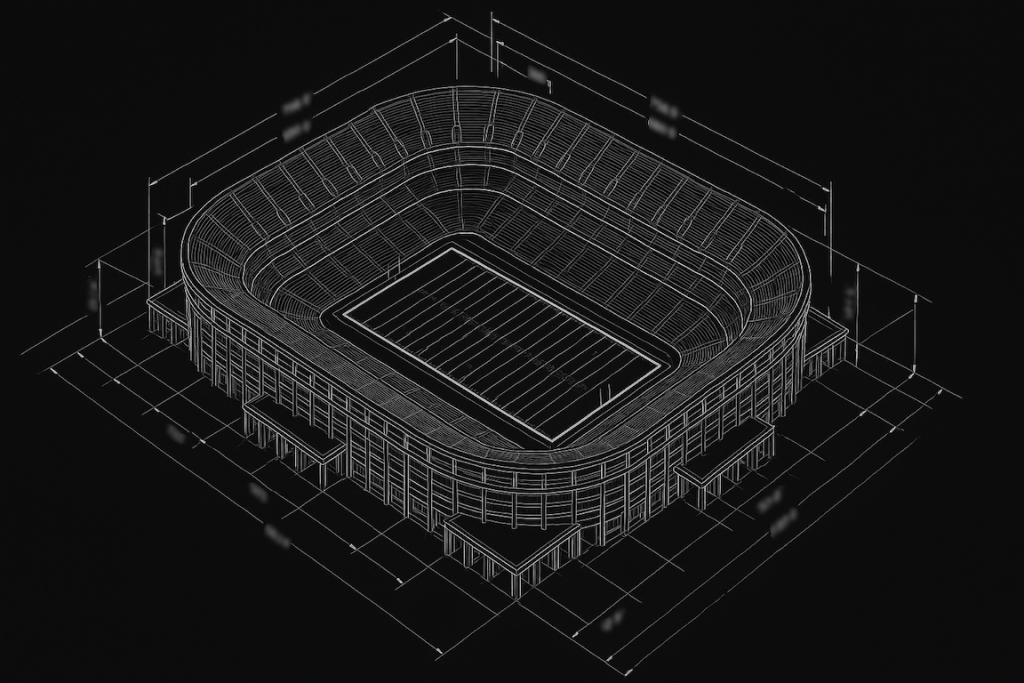
The most obvious starting point in baseball is to look at how atmospheric variables impact a home run-like fly ball. Even a few inches of impact to distance can be the difference between a multi-run homer and an inning-ending out, significantly impacting game outcomes. The launch parameters we will use for this simulation would have the ball just barely clear the top of the center field fence of our digital stadium in standardized conditions. This allows us to more directly interpret the impact of atmospheric conditions on whether this hit would be a home run (or not) in the given conditions!
Temperature
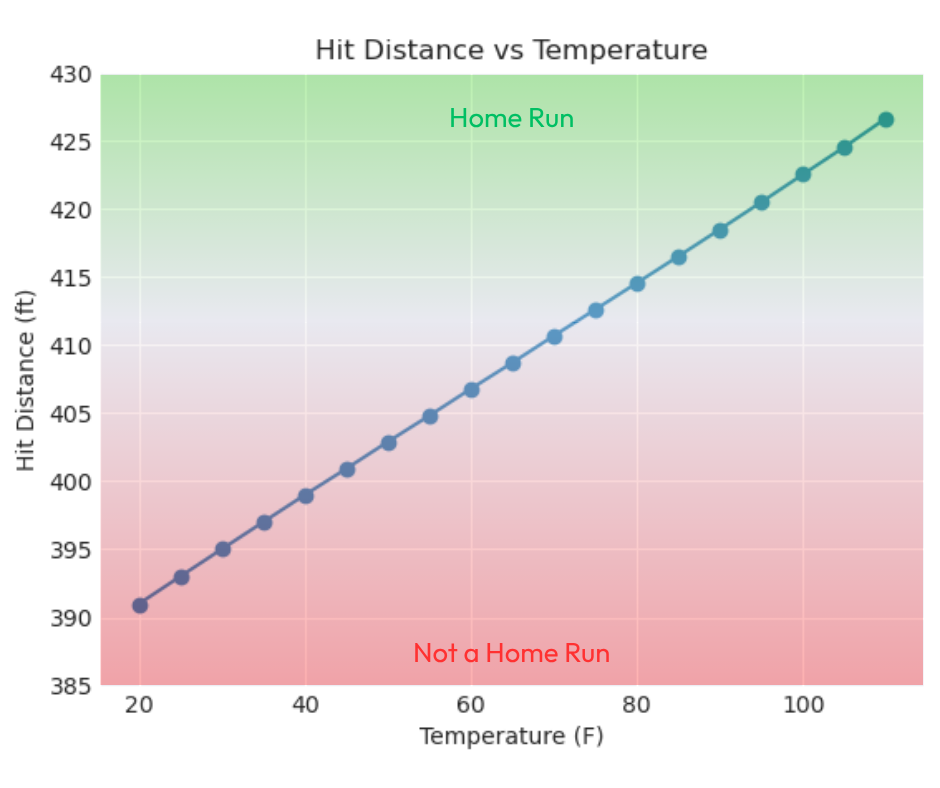
As we see above, the same home run-like fly ball hit in 55° weather travels about 10 feet farther when the temperature rises to 80°. Many fly balls fall within that margin of the outfield wall, so temperature-driven changes in air density can alter home run rates and game outcomes significantly. This is because air becomes less dense and offers less drag to a moving baseball as it warms. For a home run-like fly ball, we see about a 4 ft increase in distance for every increase of 10°F.
Many baseball fans are familiar with the work of baseball physicist Alan Nathan, whose research established the widely cited rule of thumb that a 10° rise in temperature increases a typical fly ball by 3 feet (3.3 ft). Our findings align with those results. In the above simulation, our home run-like ball gains closer to 4 feet (3.8 ft), while instead simulating with the parameters of a typical fly ball results similarly in an increase of about 3.3 feet per 10°.
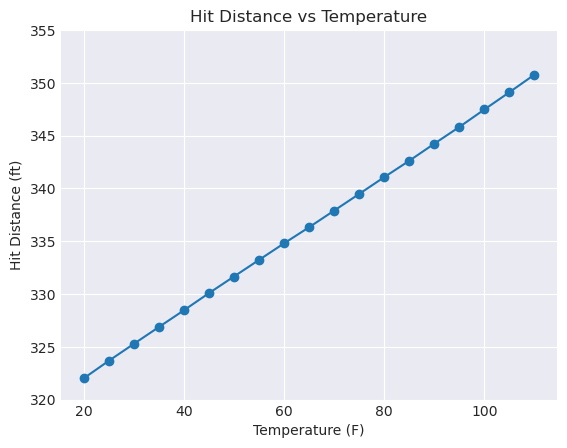
The plot below utilizes average hit parameters from MLB data and similarly shows roughly a 3 ft gain per 10° increase in temperature. The values change slightly, but the underlying principle is simple: The longer the ball stays in the air, the more temperature and other atmospheric variables can influence its flight.
Rough Rule of Thumb: Home run-like fly ball distance increases by about 4 feet for every 10°.
Rough Rule of Thumb: Average fly ball distance increases by about 3 feet for every 10°.
Altitude
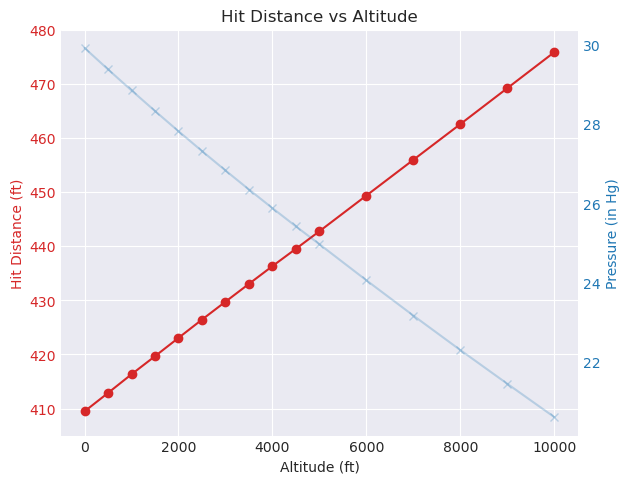
Decreases in air density related to altitude are actually a result of the decreased pressure that occurs at higher altitudes. In the visual above, you can see the red line comparing how our fly ball distance changes relative to altitude. The light blue line is there to also visualize the relationship between altitude and atmospheric pressure. In our altitude-based simulations, this hit would fly more than 30 feet farther at an altitude of 5,280 feet (1 mile) than the same hit at sea level!
Rough Rule of Thumb: Home run-like fly ball distance increases by about 6 feet for every 1,000 feet of altitude.
Atmospheric Pressure

At a constant altitude, atmospheric pressure changes gradually as large-scale weather systems move through. In this simulation, we modeled the difference between a strong high-pressure system (around 30.40 inHg) and a deep low-pressure system (around 29.30 inHg), a range that captures the stronger end of normal weather-related pressure changes for a single location.
Our results show that such a change can add roughly 7 feet of distance to a home run-like fly ball. A shift of this magnitude (about 1 inHg) usually unfolds over several days, while smaller variations of around 0.3 inHg are far more typical from day to day.
Rough Rule of Thumb: Home run-like fly ball distance increases by about 2 feet for every 0.3 inHg drop in pressure.
Relative Humidity
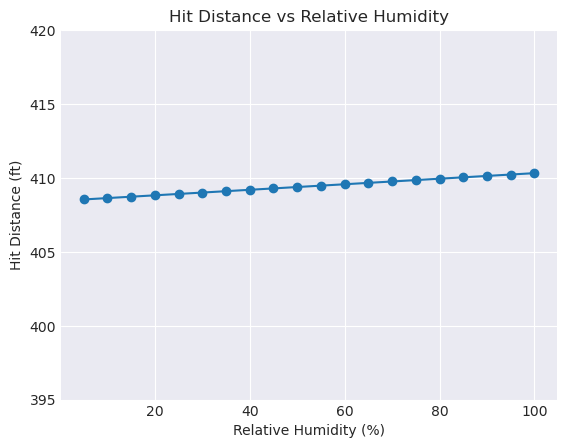
The impact of relative humidity on a ball in flight is subtle and often misunderstood. Since water vapor molecules are lighter than dry air molecules, humid air is actually less dense, which slightly reduces air resistance. In our simulations, moving from 0 percent to 100 percent relative humidity increases carry distance by only about 2 feet. That effect is real, although small compared to other atmospheric factors.
In real game conditions, humidity influences more than just air density. Moisture can be absorbed into the baseball. This can slightly increase the ball’s mass and affect its elasticity, which affects both batted-ball speed and how the ball carries. These physical changes can offset the aerodynamic benefit. As a result, higher humidity can shorten flight distance rather than increase it in practice. MLB mandates humidors for all teams to standardize baseball moisture content and keep ball performance more consistent.
But because humidity can alter the ball itself and its air-density effect is small, the net impact is subtle and hard to isolate in real game conditions. Utilize this rule of thumb accordingly.
Rough Rule of Thumb: Home run-like fly ball distance increases by about 1 foot for every 50% increase in humidity.
Pitches and Other Hit Types
While this analysis focuses on a home run-like fly ball, atmospheric effects extend to all batted and pitched balls. Pitches can be especially sensitive to air density due to spin, which can influence pitch movement through changes in drag and lift. Line drives and pop-ups experience different aerodynamic forces based on spin and launch angle, though generally speaking the longer the ball is in the air, the greater impact atmospheric variables can have.
Summary
The takeaway is simple: the atmosphere always plays a role, even when it’s invisible.
Join us as we explore how weather and physics influence performance across different sports! Visit Modeling the Impact of the Atmosphere on Sport: Setting the Stage, where we discuss the methodology of these simulations and will link to other sport- and play-specific analyses as they become available.
Rule of Thumb Cheat Sheet
For home run-like fly balls:
- Warmer air: +4 ft per 10° rise (+3 ft for average fly ball)
- Higher altitude: +6 ft per 1,000 ft
- Lower pressure: +2 ft per 0.3 inHg drop
- More humidity: +1 ft per 50% rise
Click here to get our blog sent to your inbox, and follow us on X (Twitter) and Bluesky!
Learn more about Weather Applied Metrics.