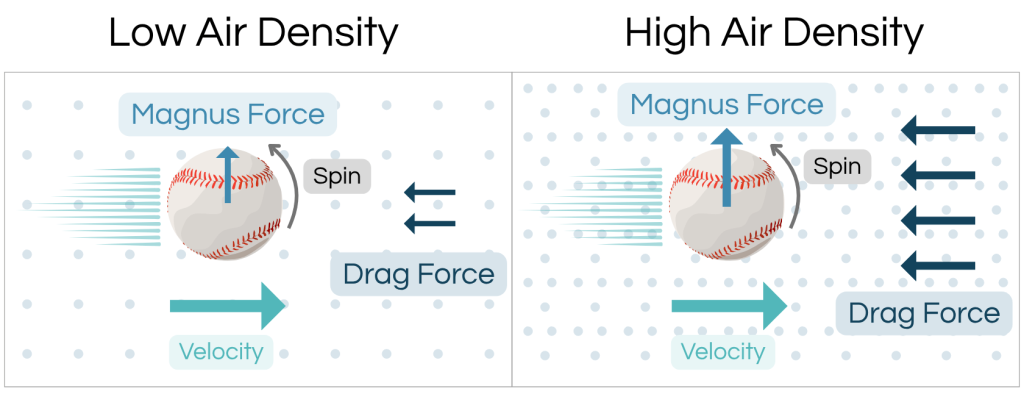
Wind is one of the most important and impactful forces in outdoor sports. Every pitch, pass, shot, or hit moves not only through the air but also with or against the motion of the air itself. As the leading provider of weather-related analytics for the sports industry, our technology is utilized to quantify the impact of weather on sports. Yet before diving into the specifics of how wind can dramatically reshape ball flight, it’s helpful to have some foundational understanding of wind behavior.
We first need to understand two things:
- What is wind?
- And why does it change?
Wind Fundamentals: Pressure, Motion, and Variability
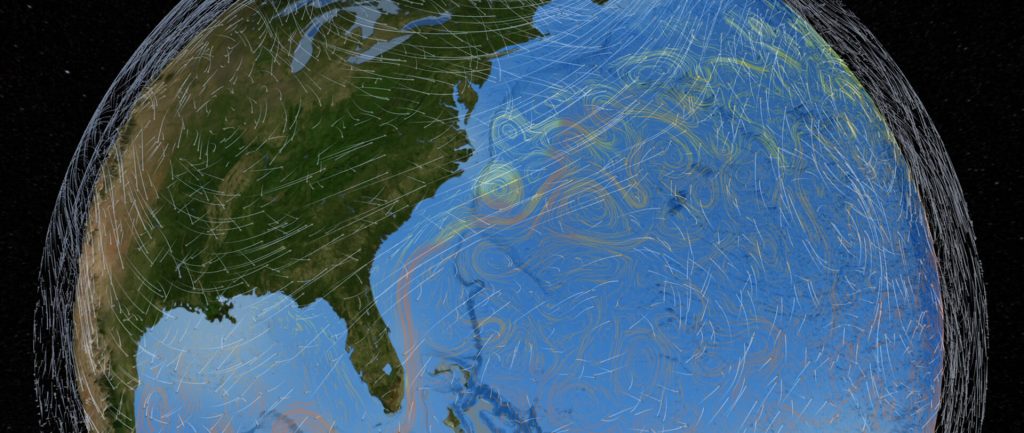
Wind is simply air in motion, caused by pressure differences when the Earth’s surface heats unevenly. Air flows from areas of high pressure to low pressure, but the path is rarely straight. The Earth’s rotation and friction from the ground both change its speed and direction, shaping the patterns we feel as wind. Some regions are much windier than others because of how those pressure differences combine with geography. Coastlines, desert plains, cities structures, and mountain valleys all impact wind directions and speeds in various ways.
Wind is a vector, meaning it has both speed and direction. Speed describes how fast the air moves, while direction tells us where it comes from, for example, a westerly wind blows from west to east.
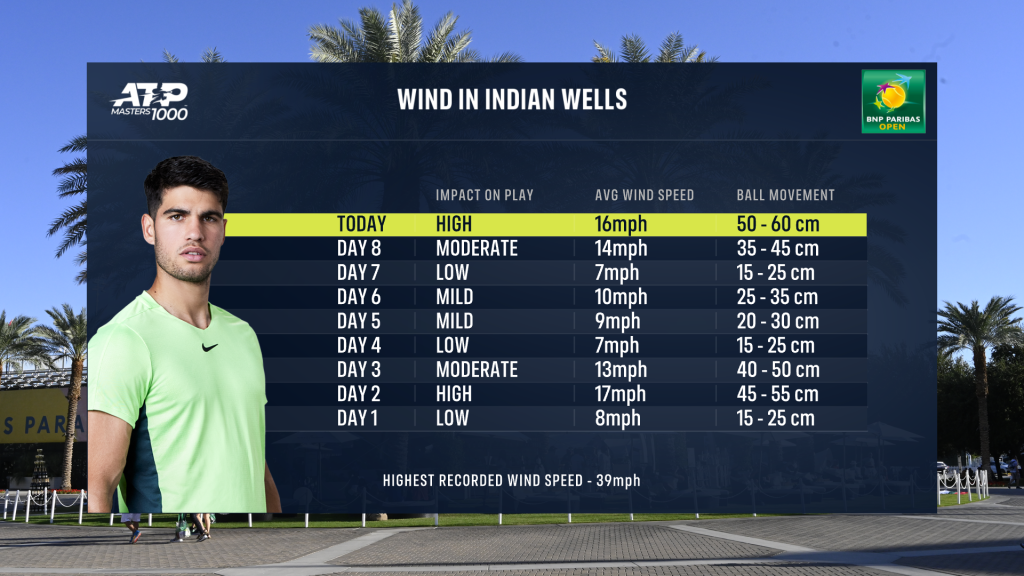
Near the ground, friction from trees, buildings, and terrain disrupts airflow, making it more turbulent and variable than winds higher up. Meteorologists describe both sustained winds (the average over a short period) and gusts (brief bursts that rise above that average). These variations are what make wind feel alive, shifting, and sometimes chaotic, even on an otherwise calm day.
Measuring the Wind: Standards and Challenges
To study or model wind, we first have to measure it, a task that is both standardized and complex. Most official measurements are taken with anemometers (wind sensors) mounted at a standard height of 10 meters (about 33 feet). A height intended to reduce the interference from the ground and trees while representing the layer of air that is generally most relevant to people in their day-to-day lives.
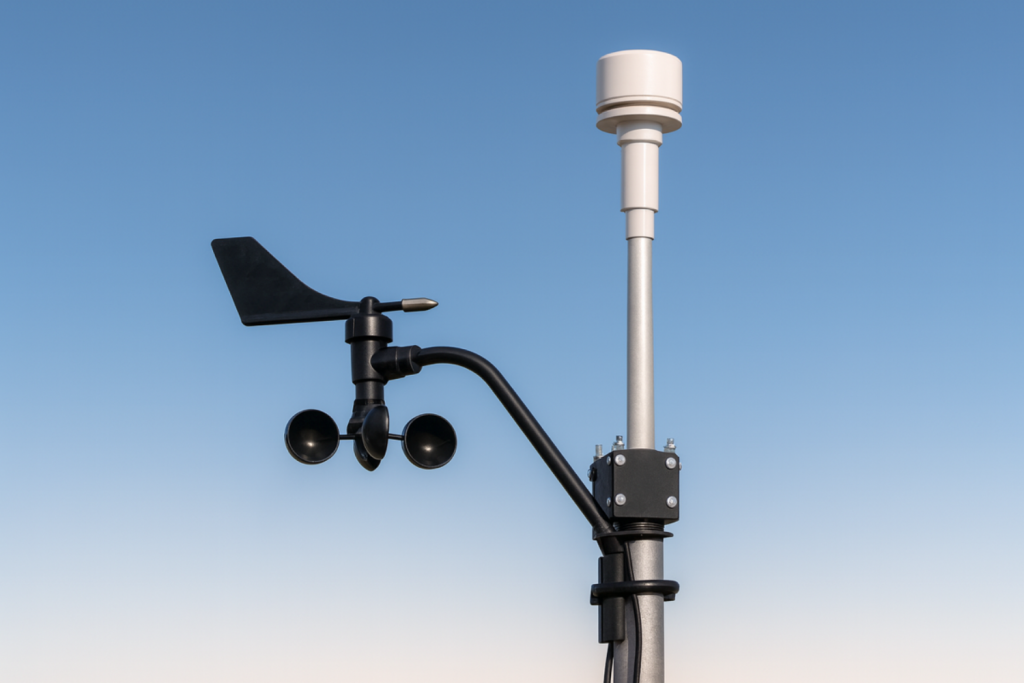
A global network of weather stations collects this data continuously, with many of the most reliable sensors located at airports. Because aviation depends on real-time wind information, airports have become the backbone of the world’s surface wind network. Meteorologists use this data to power forecast models, track storms, and study long-term patterns.
But even with these standards, wind is never truly uniform. The wind measured 10 meters above an open runway might differ completely from what you feel in your backyard just a few miles away. Local topography, vegetation, and buildings all reshape and redirect airflow, creating pockets of shelter, gusty corridors, and swirling eddies.
Describing wind with a single number is convenient, but overly simplistic. In reality, it is a complex, three-dimensional flow that constantly changes with height, location, and time.
Why Wind Changes: From Hour to Day to Season
Wind changes because the atmosphere is always adjusting to uneven heating across the planet. That imbalance drives the air’s motion and creates patterns that shift by the hour, day, and season.
During the day, sunlight warms the ground, heating the air near the surface and mixing it with air above. This mixing brings stronger, gustier winds down from higher levels, which is why afternoons often feel breezier. At night, the ground cools and the air becomes more stable. Surface winds slow or go calm, while faster winds may continue flowing above.
Seasonal changes happen on a broader scale. As temperatures and weather patterns shift through the year, the atmosphere forms different pressure conditions that influence wind. These shifts affect both wind speed and direction, establishing the broad wind patterns that shift with the seasons.
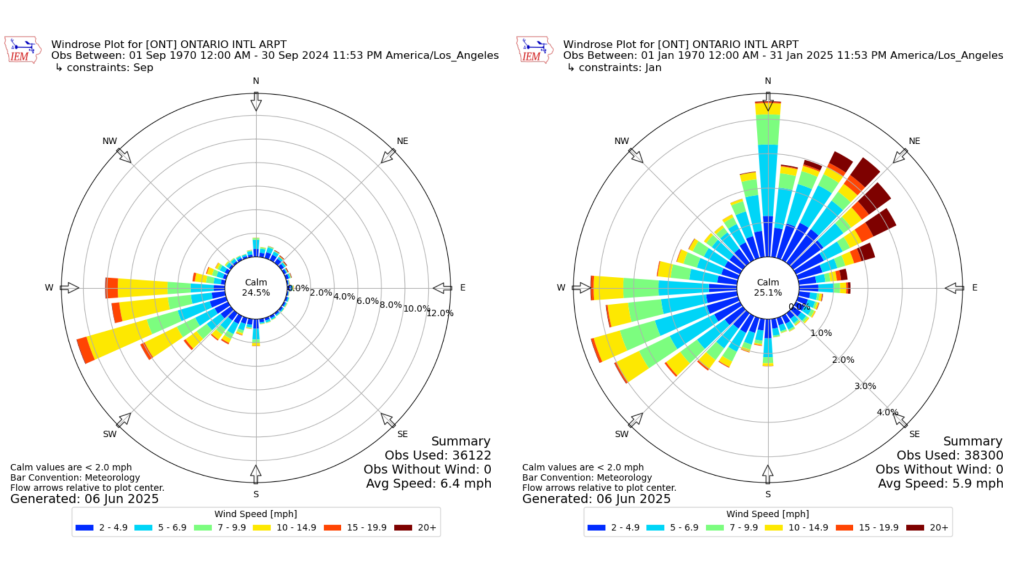
Wind roses (above) are used to summarize how wind behaves at a specific location over time. Each spoke points to where the wind comes from, with length showing frequency and color showing wind speed. In this comparison, the September wind rose (left) shows mostly westerly winds, while the January wind rose (right) includes strong northeast winds typical of Santa Ana events, highlighting an extreme example of seasonal differences in wind behavior.
Local Patterns and Microclimates
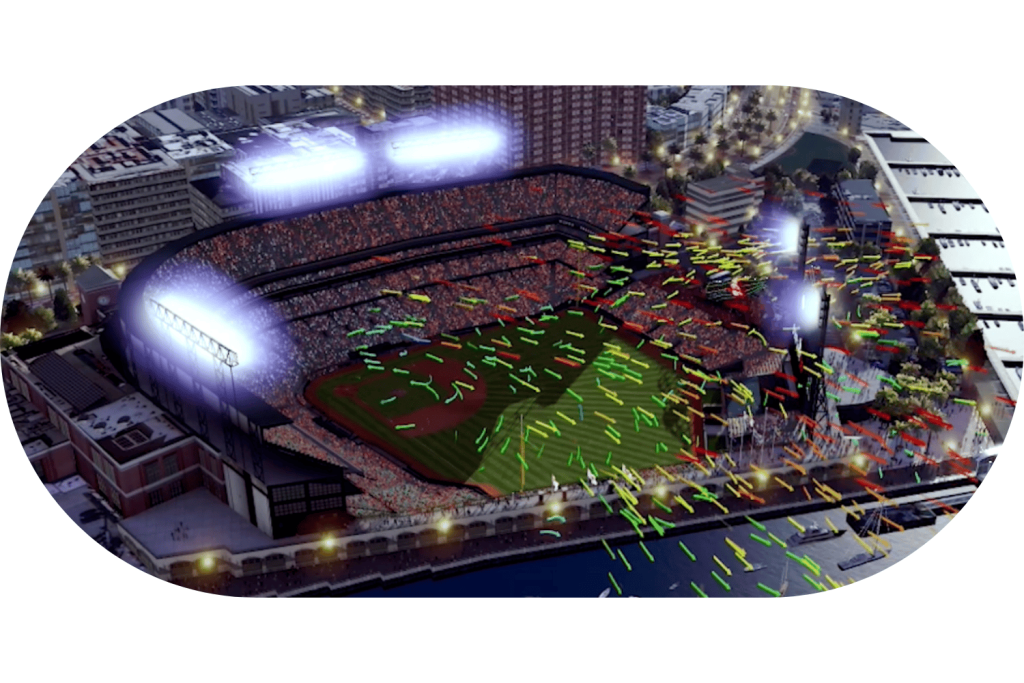
Even with global and seasonal patterns, local features often tell their own story. The land, water, vegetation, and built environment (including stadium structures) all influence how wind behaves close to the surface.
Coastal regions experience sea breezes during the day as warm air rises over land and draws cooler air in from the water. At night, this reverses into a land breeze as the surface cools more quickly. Valleys can funnel and accelerate air, while hillsides, forests, and ridges can block or deflect it. In cities, tall buildings and narrow alleyways create turbulence, redirecting wind in complex ways.
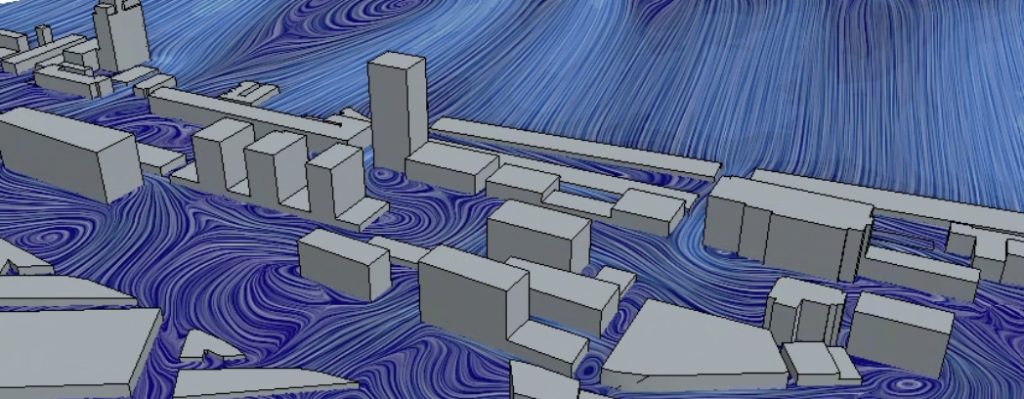
These local effects form distinct microclimates, small areas where wind conditions differ from their surroundings. That is why the breeze on one side of town, or even one end of a stadium, might feel entirely different from another. Wind can shift from moment to moment because of turbulence caused by wind shear (changes in speed or direction with height) and convection (rising warm air and sinking cool air). While modeling is extremely helpful for understanding windfields, there are small-scale motions that happen on such fine scales (e.g. molecular) that models may not fully capture.
The Ever-Changing Nature of Wind
Wind is a complex, chaotic, and dynamic fluid shaped by countless interacting forces that make it both fascinating to study and challenging to predict. That being said, wind does follow daily, seasonal, and local patterns that can be analyzed and anticipated. By understanding how wind behaves, changes, and interacts across space and time, we can better predict its real-world effects. That understanding sets the stage for the next step, exploring how wind interacts with drag, spin, and trajectory to influence every ball in flight.
Key Takeaways
- Wind is driven by pressure differences from uneven heating of the Earth’s surface.
- It has both speed and direction, influenced by rotation, friction, and terrain.
- Official measurements at 10 meters provide consistency but miss local detail.
- Wind changes daily and seasonally as the atmosphere seeks balance.
- Local terrain and microclimates can dramatically alter wind, even within the same venue.
Click here to get our blog sent to your inbox, and follow us on X (Twitter) and Bluesky!
Learn more about Weather Applied Metrics.